Implementation of Market Risk (VaR)
 Download Case Study
Barwa Bank operates in an environment that has witnessed rapid changes in customer expectations and the regulatory environment and these have required technological innovation. Barwa Bank has adopted a pro-active approach in managing these challenges. One of the key focus areas for the Bank is the management of Market Risk. The Bank has seen a significant expansion in its portfolio in terms of volume, diversity in instruments and markets in the last 3 years. This led to an increasing requirement for an efficient and robust measurement and reporting tool for Market Risk management.
Barwa bank selected Oracle for a complete Enterprise Risk Management solution and Techlogix as its implementation partner. The first phase of the project focused on Operational Risk to be followed by the implementation of Basel II and Market Risk. In the second phase, additional risk modules will be implemented. Techlogix has successfully delivered and taken live all the three modules in phase I.

Market Risk (VaR)
Market Risk provides extensive and robust computations that enable institutions to effectively evaluate and manage risk across interest rate, equity & currency exposures through calculation of measures such as Value-at-Risk (VaR), Conditional Value-at-Risk (CVaR) and Component VaR and covers a wide range of instruments types. Some of the instruments developed by Barwa Bank are:
- Government Sukuk (Fixed Rate)
- Corporate Sukuk (Fixed Rate)
- Corporate Perpetual Sukuk
- Corporate Sukuk (Floating Rate)
- Government Sukuk (Floating Rate)
- TBills
- Equity funds
- Private equity funds
- Currency spot
- Profit Rate Swaps
The solution is also capable of calculating Incremental and Marginal VaR.
VaR Methodologies
The following methodologies were implemented:
Historical Simulation Method
Historical model takes into account historical movement in instrument value (e.g stock price, profit rate, exchange rate etc.) to predict risk. The system supports valuation of all the instruments present in the Barwa portfolio. The system provides flexibility to accommodate larger look back periods and different confidence levels.
Analytical Method (Variance – Covariance Approach)
The Variance-Covariance Matrix of risk factors is estimated using the Exponentially Weighted Moving Averages (EWMA) method and Generalized Auto Regressive Conditional Hetroscedasticity (GARCH) methods. Seasonal adjustments are factored in while estimating variance and covariance for risk factors, which exhibit seasonal behavior in the price movements.
Monte Carlo Simulation Method
It encompasses probabilistic approach to generate random simulation for instrument values. For every run it generates different random simulations which is very useful for the business to monitor each and every possibility.
VaR Models
The following VaR models were configured at Barwa Bank:
- Historic Simulation 1 day VaR at 99% Confidence Level
- Analytical Model 1 day VaR at 99% Confidence Level
- Analytical Model 10 days VaR at 99% Confidence Level
- Analytical Model 30 days VaR at 99% Confidence Level
- Monte Carlo Model 1 day VaR at 99% Confidence Level
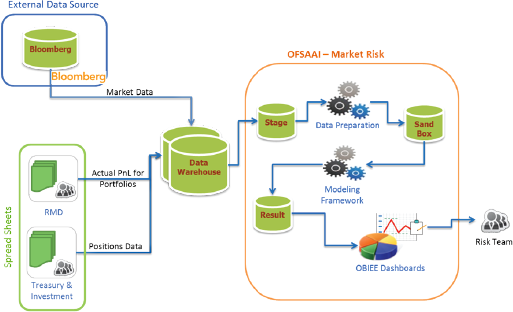
Integrated Solution Diagram
Solution Architecture
The Techlogix team designed, developed, and deployed the solution on a network of clustered SUN Solaris servers supporting fault tolerance. OFSAAI 7.3 was deployed in a multi-tier environment mode on Sun Solaris Servers with Weblogic 11g. The Oracle Financial Service Data Model was implemented integrating with the Bank’s core banking and other operational source systems. Oracle Data Integrator was used as the ETL Engine to automatically fetch data to the Data warehouse and provide it to the Market Risk Solution. OBIEE was used as the reporting and analytics server. Oracle 11g was used as the database for both ATOMIC & CONFIG schemas of OFSAAI and the Market Risk Solution was also configured on an Active-Passive SUN cluster. A complete Disaster Recovery Environment was also developed. OFSAAI also used Bank’s SMTP server to send out notification email messages generated by Risk Solutions.
Assess risk at any level of granularity
Oracle Market Risk enables institutions to estimate the risk for multiple, user-defined portfolios. Portfolios are defined based on a combination of one or more dimensions such as Counterparty, Line of Business, Legal Entity, Asset Class, Asset and Instrument Type etc. This enables assessment of risk at any required level of granularity in the organization.
Barwa required Techlogix to devise a strategy for portfolios so that maximum granularity can be achieved. To start with we defined 6 portfolios (1 for all instruments, 1 for Forex, 1 for Equities, 1 for Sukuks/bonds, 1 each for Banking and trading desk Sukuks/bonds). Later on more portfolios were identified and created according to the business requirements for different equity types. The system is now capable of measuring VaR for all these portfolios on a daily basis. Also, further portfolios, either a sub-set or a super-set of these portfolios can be defined by the Barwa functional team as they require without the support of Techlogix.
Another challenging task was that Barwa bank required to calculate the VaR figures for its banking book exposures as well. The requirement was studied and possible options were presented. The solution is now capable of calculating VaR for both the Trading book and Banking book.
Back-Testing
Back Testing is very important for validating the accuracy of the model in capturing the risks. Oracle Market Risk compares the VaR computed for portfolios with the Hypothetical and Actual P&L of the portfolio. Hypothetical P&L is computed by Oracle Market Risk using historical positions as part of VaR computation process. Loss exception is the number of times the hypothetical / actual loss exceeds the estimated VaR value for a given confidence level. Following are some of the report parameters configured at Barwa for Back Testing:
- Hypothetical P&L
- Profit/Loss Exceptions
- P-value
- Critical Value
- Loss Exception Deviation
- Average Loss Duration
- Loss Duration Deviation
Stress Testing
Stress Testing is an important component of any risk management process and complements the VaR measures. Stress scenario definition is quite flexible and allows for multiple risk factors shocks for different portfolios. Below is a list of stress testing scenarios defined for Barwa:
- Black Monday
- European Currency Crisis
- Gulf Equity Shocks
- US Rate Hike
- Russian Currency Crisis
- Nikkei Stock Price Correction
- Asian Financial Crisis
- Brazil Real Crisis
- Equity Price Rally
- Subprime Mortgage Meltdown
The above are fully configurable for any change. In addition to this, new scenarios can be added to the system from the front end.
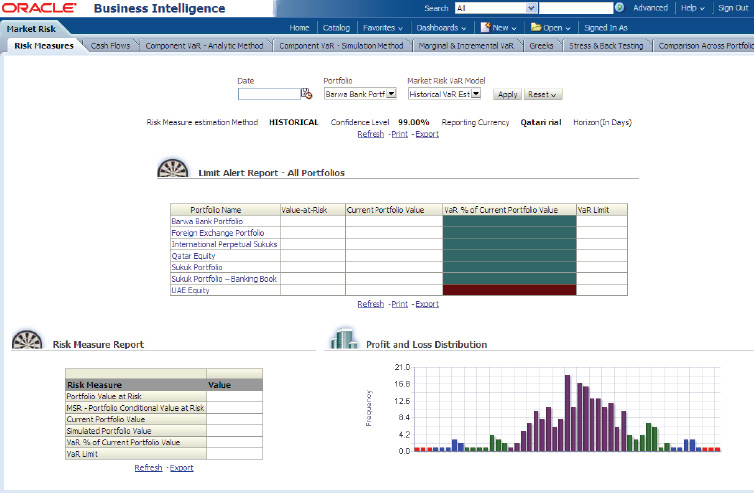
Reports
Oracle Market Risk provides set of different reports which consisting of following categories:
- Risk Measure Reports
- Cash Flow: Reports under this option
- Component VaR – Analytic Method
- Component VaR – Simulation Method
- Marginal and Incremental
- Stress and Back Testing
- Asian Financial Crisis
- Comparison across Portfolios
- Comparison across VaR models
- Market Analysis
Each of the above categories has at least four reports using different dimensions for further analysis. However, Barwa also required some additional graphical and tabular reports which were customized by Techlogix, these includes:
- VaR limit breach alert report: Barwa wanted to see if any portfolio has breached its limit of VaR values.
- Portfolio VaR Drill Down Report: This report shows component VaR instrument wise for all portfolios highlighting instruments performance in a portfolio.
- Equity Market Analysis: This set of reports highlights equity price movement in the market and calculates different ratios like: Mean excess return, Standard deviation access return, Sharp ratio, Information ratio, Treynor ratio, Liquidity duration.